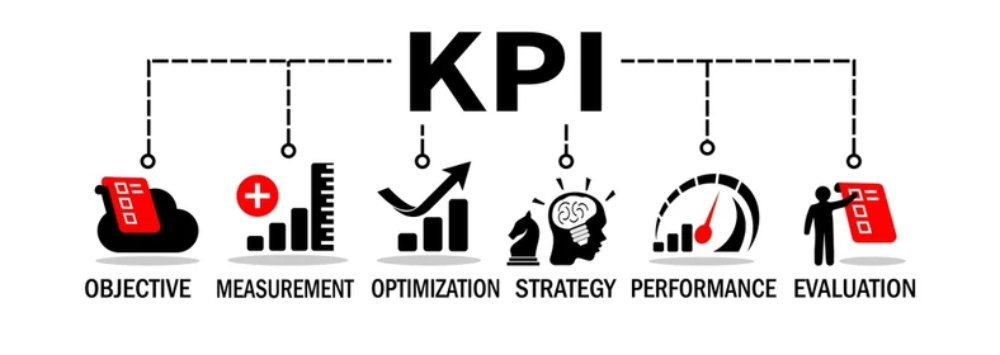
Welcome to the bleeding edge of meaningless metrics. At the KPI-Driven Institute, our mission is to collect, generate, and misinterpret as much data as possible in order to justify our own existence. We believe strongly in performing productivity, especially in colourful dashboard form.
(based on emoji use)
(learning optional)
(introduced last Tuesday)
Our dashboards are refreshed in real-time to ensure no one ever asks what any of this actually means. As we say in the KPI Hallway: “If it looks impressive, it is.”
Staff Performance Tracker
"Because excellence is just a number we made up."
Welcome to this week’s *Perfunctory University* staff leaderboard, where we gamify academic irrelevance. Forget teaching quality or student growth — these are the KPIs that *really* matter:
| Rank | Staff Member | Meetings Attended While Muted | Emails CC’d (Unnecessarily) | Buzzwords per Minute | Modules Cloned Without Updating | Passive-Aggressive Comments on Teams |
|---|---|---|---|---|---|---|
| 1 🏆 | Dr. Alison “Synergy” Frame | 34 | 872 | 6.9 | 5 | 12 |
| 2 | Prof. Mike “Let’s Park That” Hobbs | 27 | 745 | 7.2 | 4 | 15 |
| 3 | Dr. Karen Metrics-Jones | 18 | 689 | 8.4 | 6 | 9 |
| 4 | Mr. Toby "Pivot Table" Patel | 22 | 604 | 5.3 | 3 | 7 |
| 5 | Dr. Susan “We’ll Circle Back” Grant | 12 | 512 | 9.1 | 4 | 11 |
🏅 Bonus points next week for “Mic Not Working” incidents and use of “Thought Leadership” in casual conversation.